5 features that help you power up AWS observability

Before we take a deep dive into the ways to achieve observability, it is important to understand what observability is and how it is achieved. Frequently, observability is confused with monitoring. Observability provides end-to-end visibility into a system’s internal health by using the data it generates: logs, traces, and metrics. In a multi-cloud environment, observability enables you to detect and resolve anomalies.
In contrast, monitoring pertains to collecting and analyzing data from a specific process to guide business decisions. Monitoring involves the simple capture and display of data, whereas observability involves the collection and analysis of system-level health metrics. For instance, through monitoring, you can actively watch a single metric for changes that indicate a problem.
A range of operational issues
The major challenges of achieving observability in an environment like AWS are the operational issues that architects often firefight. For instance, if you’re trying to understand the customer journey on your webpage hosted on AWS, you'll realize that longer page load times lead to poor customer retention, which in turn results in greater bounce rates. Consequently, you'll implement architectural changes in order to proactively prevent page load issues.
It is important to understand the why and what of user issues. You must address important questions like:
- Where do users experience slowness?
- What is the uptime of the service?
- What KPIs should be established for a particular service?
Power up AWS observability
In simple terms, achieving observability is a twofold approach. The first is alignment between business and technology teams along with business needs and goals. The second is changing the current systems to capture data in order to monitor your systems and define KPIs. This traditionalist approach might be suitable for legacy systems.
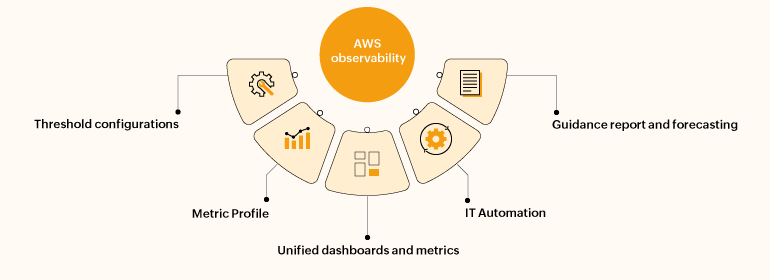
However, for contemporary, ever-evolving systems, you need a more advanced approach. Site24x7's fivefold approach, which is aligned with the three pillars of observability (monitoring, tracing, and logging), can help you achieve end-to-end observability in AWS environment. Here are the five Site24x7 features that enable this:
1. Threshold configurations
Site24x7 uses many AWS service-level APIs to automatically discover all the running service instances and their volumes from each Availability Zone. Let us consider a case where you want to create a Threshold Profile for the Amazon Elastic Compute Cloud (EC2) instance. You can simply log in to your Site24x7 account and configure Threshold Profiles by setting different conditions. The values you configure act as the thresholds for each field. In the event of a violation, the status of the EC2 instance will change from Up to Trouble, triggering an alert. These alerts can also be created through third-party ITSM and collaboration tools.
2. Metric Profile
Site24x7's Metric Profile lets you monitor metrics for each service and add metrics for each monitor. Site24x7 uses CloudWatch API calls to retrieve only those metrics you choose to monitor, reducing your overall Amazon CloudWatch costs.
3. Unified dashboards and metrics
The three major components of a unified dashboard are the Infrastructure Dashboard, Anomaly Dashboard, and Inventory Dashboard. The Infrastructure Dashboard provides your NOC with an overview of high-level health and performance metrics for every supported cloud resource monitored on your AWS platform. The Anomaly Dashboard is an AI-based dashboard that uses robust principal component analysis and matrix sketching algorithms to detect any unusual spikes or aberrations. The Inventory Dashboard shows you the overall resources of your AWS account based on regions.
4. IT Automation
IT Automation has become the norm for configuration changes, helping you deploy applications on the go and respond immediately to incidents. You can also automate repetitive tasks and the remediation of threshold breaches, as discussed earlier. IT Automation lets you achieve higher productivity, greater availability, and improved performance through proactive actions, such as rebooting a VM or dumping a thread.
5. Guidance Report
Site24x7's Guidance Report examines the resource utilization of AWS services to provide recommendations on optimizing costs and improving the fault tolerance and performance of your AWS account. The Guidance Report is divided into three categories: availability, cost, and security. Best practice recommendations are given for the various services of Site24x7. Furthermore, the instance type recommendations go above and beyond the Guidance Report to help you identify a better instance category based on your instance usage.
Observability: A journey or a destination?
With both digital adoption and the scale of operations increasing, achieving observability has become the cornerstone of seamless, successful businesses. Observability cannot be achieved overnight; it is a continuous journey. Site24x7's AWS monitoring tool helps you pursue this journey to achieve your desired business goals.