Custom Reports: Discover troublesome resources with great precision.
Reporting has always been an integral part of Site24x7 and we have taken it upon ourselves to deliver comprehensive and sophisticated reports on your monitored data. Our Summary, Availability, Performance, Health trend, and Top N reports have always helped DevOps and Network teams dissect and isolate issues in their individual monitors or monitor groups.
But, issues in your IT infrastructure doesn't always exist in silos. It's usually construed as being a by-product of issues in another IT resource. So what if you could generate a lucid report for a given time, that too on an ad-hoc manner with only specific resources, and their performance trends? A kind of personalized tabular report that allows you to quickly reveal performance trends, usage patterns and data relationships during a specific time span; one that provides the right answers to all those dreaded questions. Well, now you can with our brand new Custom Report.
How it works: Converts your mundane data to sublime reporting.
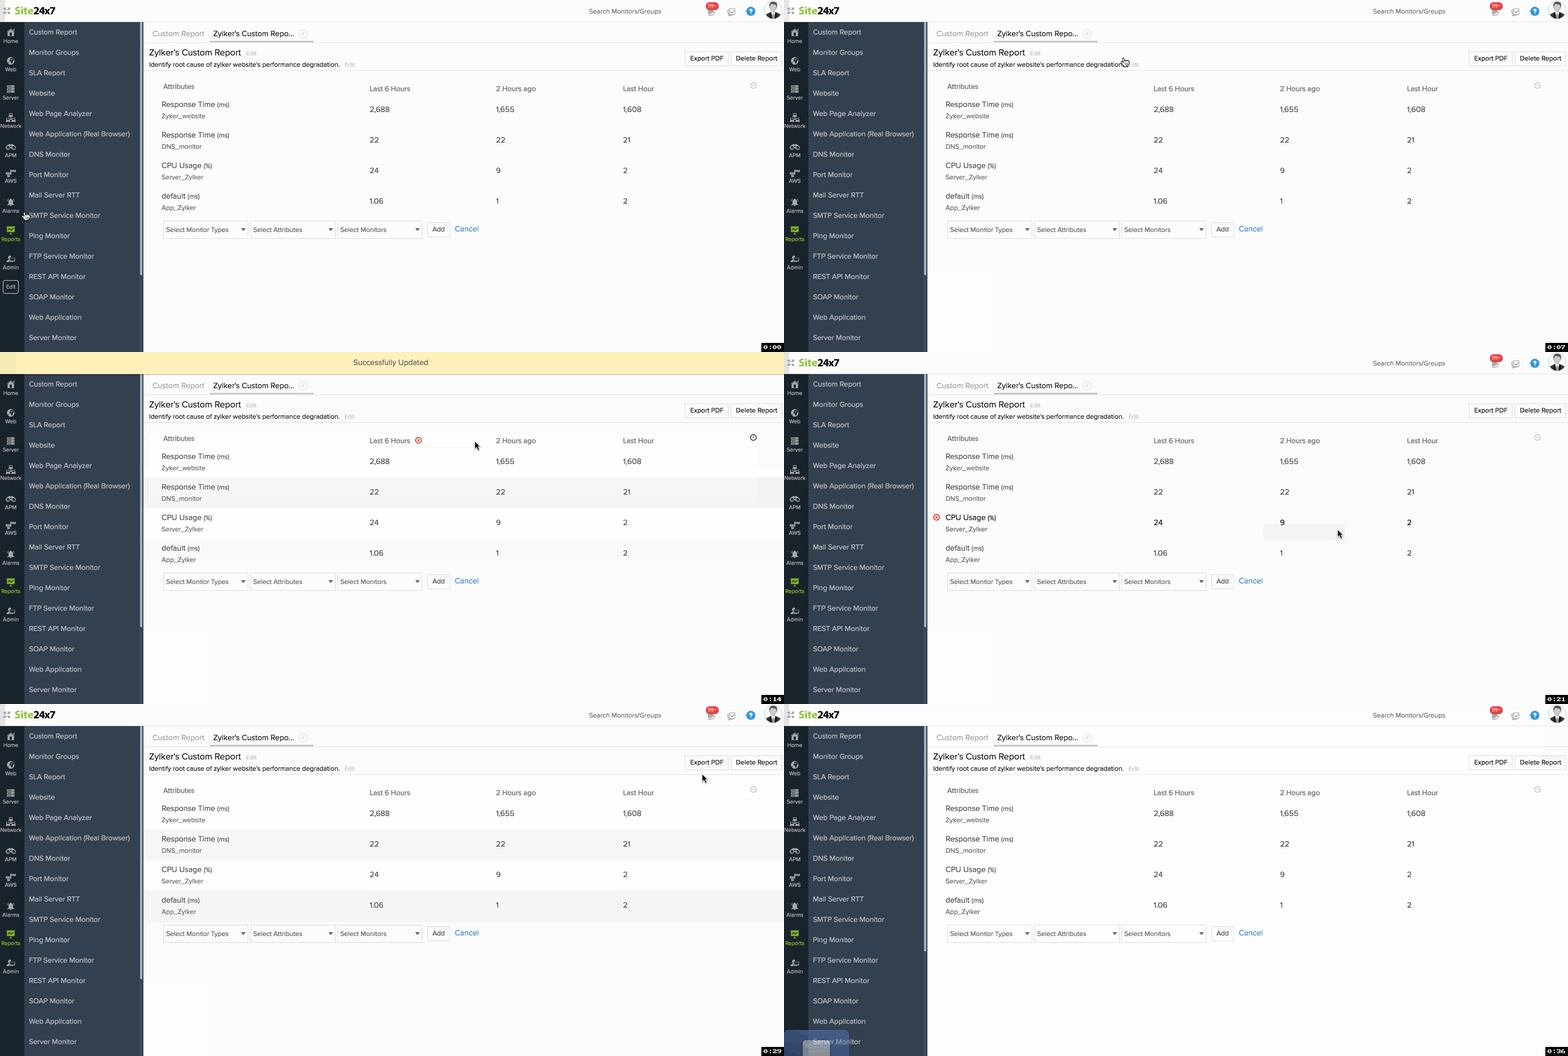
Custom reports are designed to isolate the root cause of a definite problem, often without much planning in advance. Consider a scenario where you have observed a sudden spike in the response time of your website www.zylker.com, during the last 6 hours of the day. Since there are many resources that you might suspect to have caused this, it's really hard to pinpoint at any single resource. So how would you ascertain the exact reason for this performance depreciation? One option is to generate a Performance Report with all your monitors and their metrics. Sadly, the data might overwhelm you and you'll find it hard to hunt down the actual root-cause in among your agglomeration of mundane data in the report. This is where Custom report comes to the fore.
The Custom report allows you to quickly compile and generate an ad-hoc report with relevant metrics of all those monitors that you suspect would have caused the performance degradation during the last six hours of the day. In this case, the response time for the Website Monitor (zylker.com), the DNS monitor's resolution time, CPU/Memory usage stats of the Server node (where Zylker is hosted), and finally, the web application performance from the APM Insight monitor are some of the critical resources that you might want to compare for detecting the performance bottleneck. So once the report is created, how's the RCA done? As shown here below, it can be clearly inferred from the custom report that during the last 6 hours of the day, although other monitored resources stayed below the threshold, the CPU usage of the Server had risen sharply; directly resulting in a poor page load time for zylker.com.

Data is not meant to be arcane. Customize and share reports with anyone.
The Custom report helps you analyze explicit business questions that remain unanswered with other monitoring reports. The level of customization it offers is unprecedented. There ain't any limit in the metrics or monitor types that you can compare in a single shot. You can bulk select up to five time periods, which includes time ranges that's hourly-based or even up to a year back. Additionally, you can specify a custom period range by selecting date and time using a calendar view. By providing a specific name and description for your report, you can create unique reports for individual use cases. It allows you to share customized insights with the rest of your team. However, if you want it to be shared with even more people, simply export the report as a PDF.
Need more specifics?
To learn how to personalize these reports with specific monitor metrics, check out our Custom Report User Documentation. In the meantime, if you have found other creative ways for using your custom reports, do share it with us!