IT Best Practices: Understanding Web Performance Waterfall charts
Have you seen an increase of user escalations and complaints about slow Web apps and poor performance? Are you getting intermittent Site24x7 alerts that you can’t troubleshoot? It may be time to arm yourself with a Web performance waterfall chart, and visit your friendly Web development counterparts to have some informed discussions.
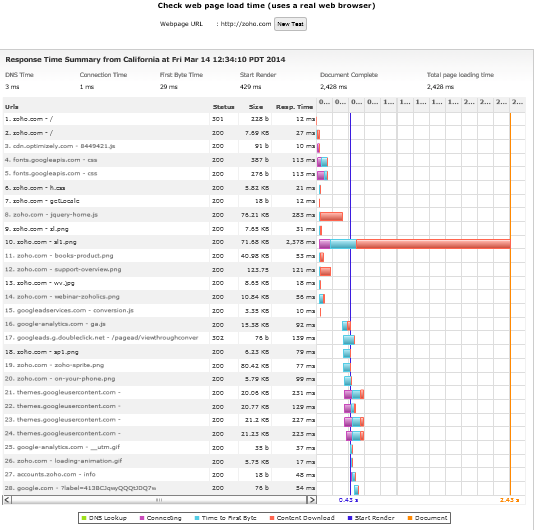
If you are new to Site24x7, run a quick test with our free SaaS tool called Analyze Full Webpage and its Objects~to get a waterfall chart.~ Just enter the Web page you are having problems with, select a Site24x7 monitoring location (you can run a couple of tests with different locations to compare), enter the access keyword you will see on the screen, and click “Test Web Page”. Voila, you will have a Web performance waterfall chart that looks something like the chart shown below.
[caption id="attachment_1742" align="alignnone" width="535"] Web Performance Waterfall Chart[/caption]
While it may be somewhat intimidating for IT pros, a waterfall chart is a diagram that depicts the series of actions that occur between a user and a server until a Web page is displayed in a user’s browser. Each row represents an object (text, images, JavaScripts, 3rd party components, etc.) that a Web page contains. In this example there are 28 rows or objects on the page.~ Each component makes a roundtrip between the user, to the server, back to the user, so whenever one single object on the page underperforms, your users experience will be negatively impacted.
Let’s take a closer look-- there are 6 key metrics to analyze, each one with a different color:
- DNS Lookup Time (bar): This is when the browser looks up the domain of the requested page. If this metric increases overtime (if you are using the full version of Site24x7 you can see evolution over time), you have a DNS problem that you should discuss with your DNS provider, or the folks running your DNS services in-house.
- Connecting (bar): This shows the user and the server sending and receiving acknowledgment that a connection has been made, and data can begin to be transferred. If you see too many pink “connecting” bars, you have a problem, so you should discuss using “keep-alives” with development to reduce the number of TCP connections. HTML caching can also help.
- Time to First Byte (bar): This is the window of time between asking for Web content and getting the first byte back from the server.~ Distance between user and content matters, so when/if this metric increases (bar is too long), or you see severe discrepancies when running this test from multiple locations you might have to discuss the possibility of using a Content Delivery Network (CDN) provider. If there are too many “time to first byte” bars you should discuss instead Best Practices around page object consolidation.
- Content Download (bar): This is the time it takes for every piece of content to be sent from the server back to the user browser. As you can see on the chart above, there is one object (usually images are the culprit) that takes longer to download. If that is the case, you might want to discuss GZIP, image compression, or using alternative 3rd party content providers.
- Start Render (line): This is the time it takes for the browser to start displaying the page. Ideally you want this to happen quickly, so the first element appears on the browser in 2 seconds or less (that way a user knows that Web content is coming). Also, if “start render” and “document complete” lines are closed, your webpage is in good shape.
- Document Complete (line): This is the time it takes for your Web page to fully load in the browser. A good rule of thumb is keeping this to 4 seconds or less (users are impatient, so after 4 second a large percentage of your visitors will leave to your competitors). Only once the “document complete” time has passed will the user be able to interact with the page. Therefore, every page that takes longer to load is a great candidate for Web Performance Optimization.
Good luck with your discussions and optimizations. By reducing the time to get to your web pages, users will no longer need to keep calling the IT helpdesk, the first line of defense when Web problems arise.
Happy Monitoring!
