Good day folks,
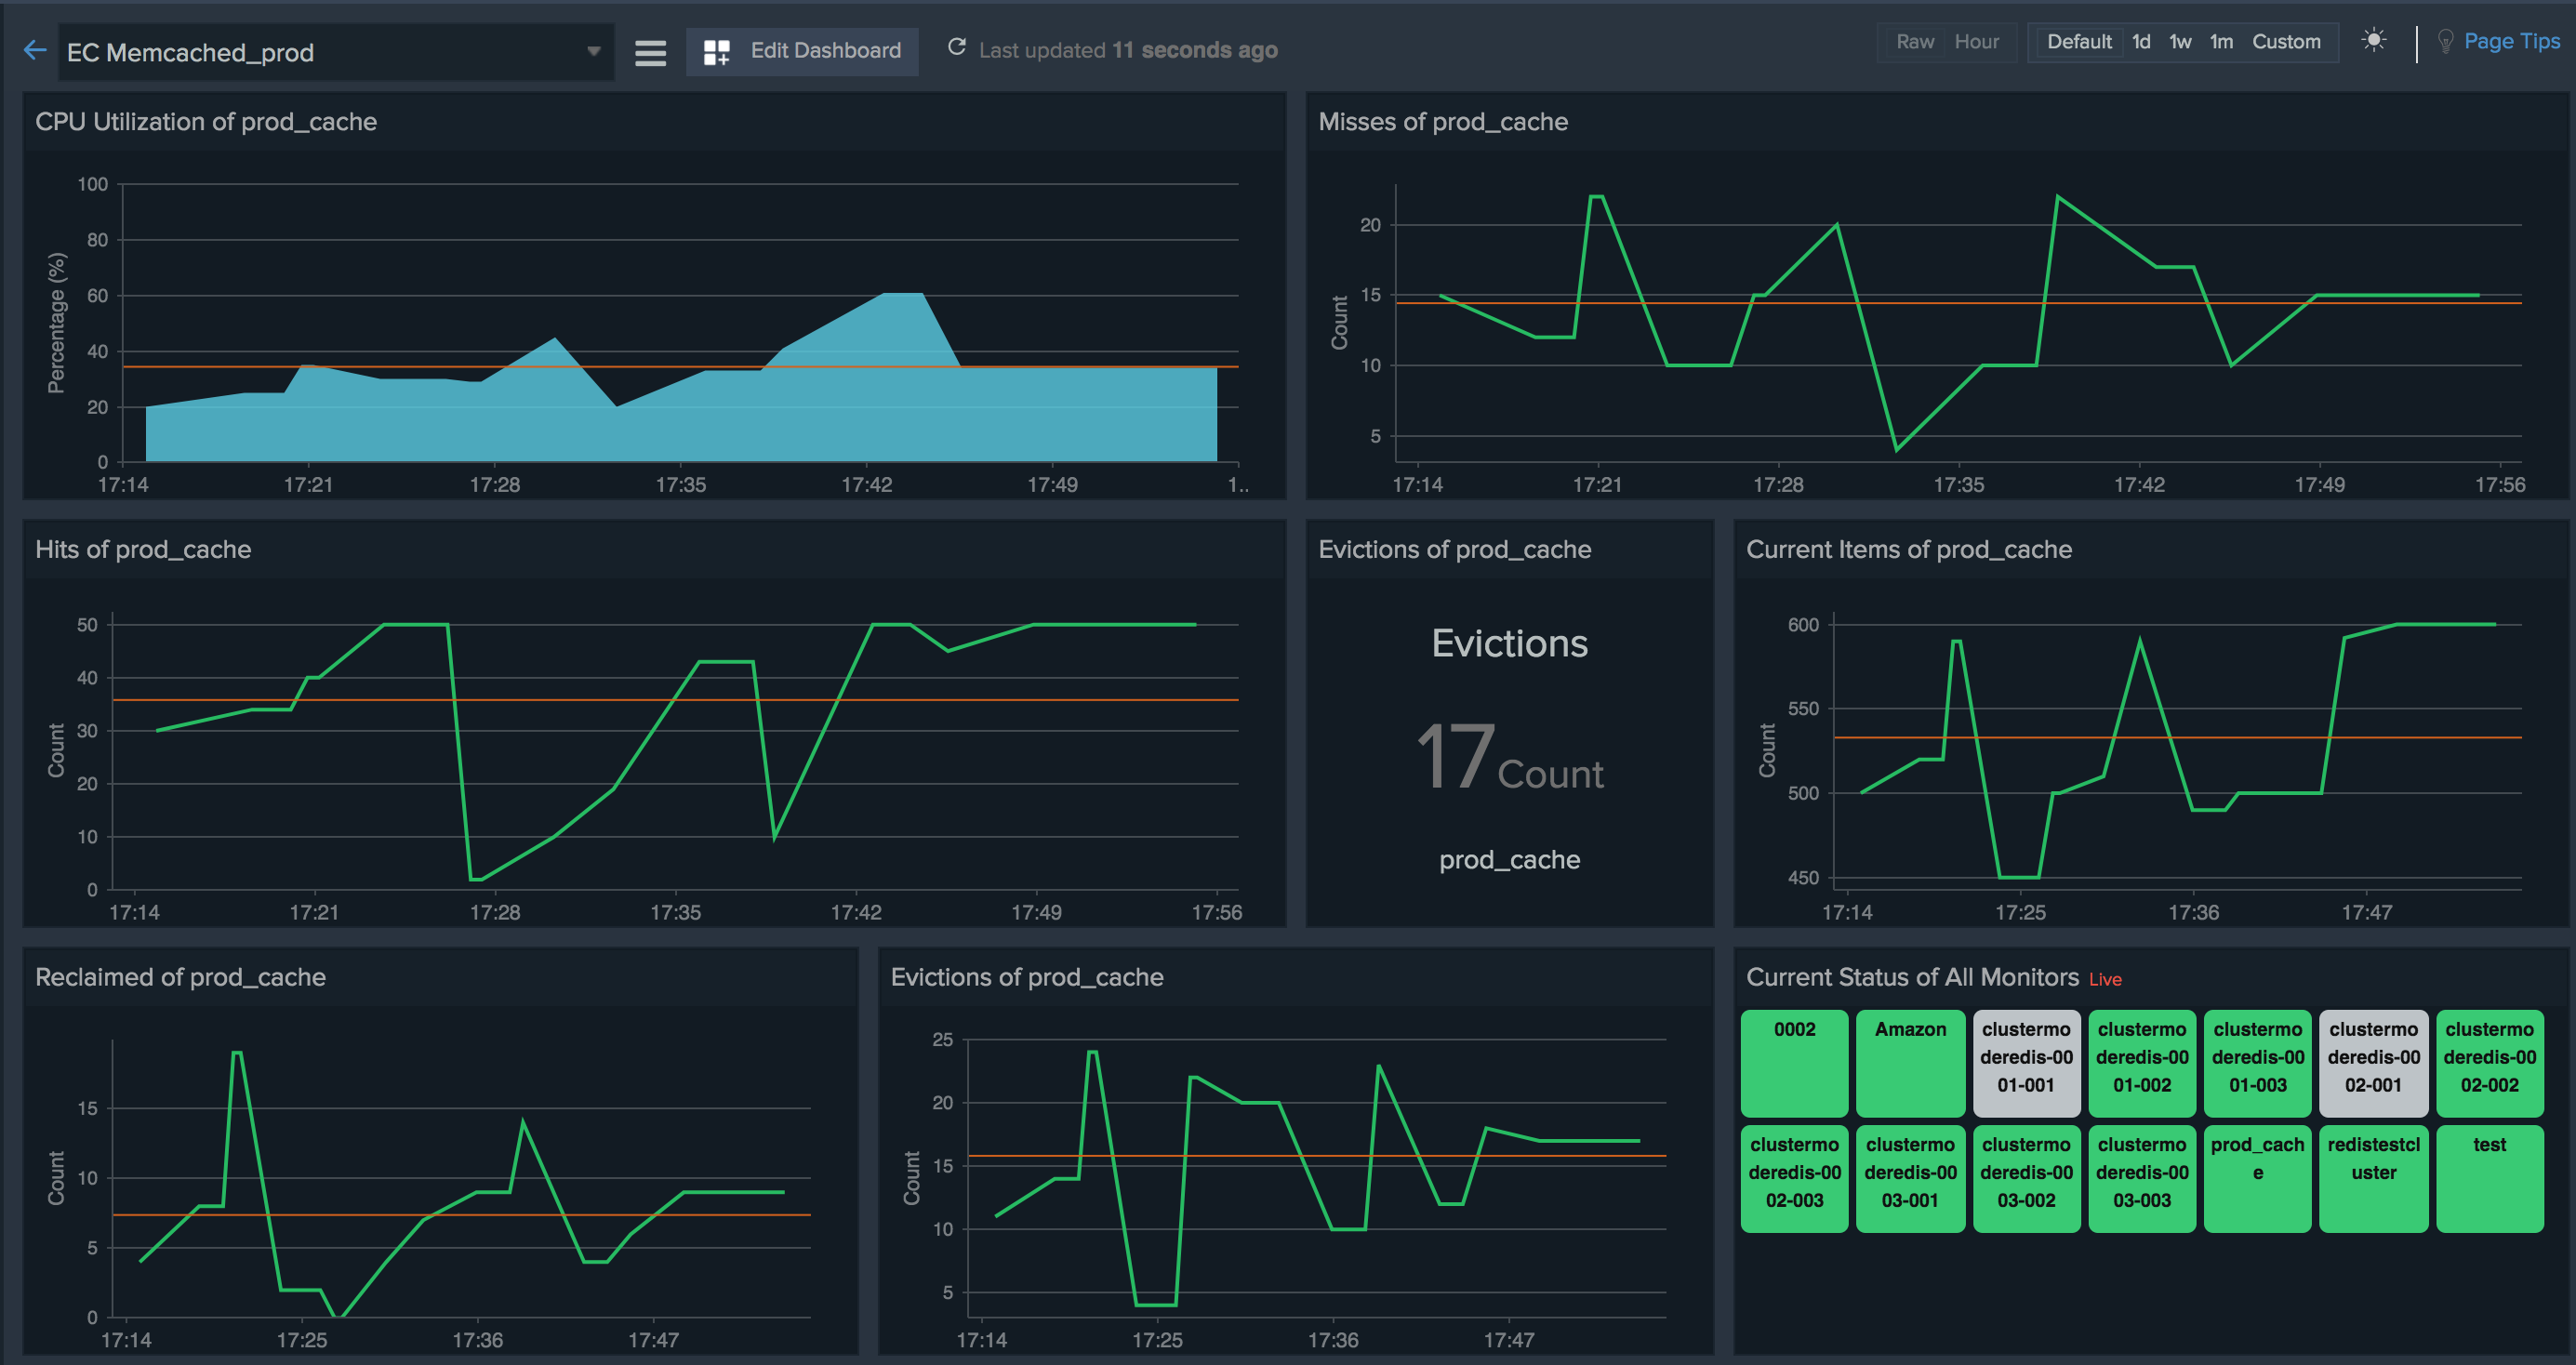
Today, I am excited to announce that we are expanding our Amazon Web Services monitoring footprint a notch further by extending support to the caching layer. Now, Site24x7 account holders, both paid and eval can monitor the health and performance of their in-memory data stores and cache environment running the Redis or Memcached engine. This includes near real-time metric data, off-the-Shelf time series graph widgets, custom reports, and alarms that can scale with your dynamic environment.
Host and cache engine metrics
Apart from standard host-level metrics like CPU usage, available memory, swap and network stats, you also get to monitor specific cache engine metrics for both Redis and Memcached.For example, you can set up thresholds to get notified of drops or spikes in metrics like hits, misses, evictions and current connections. You can also create a custom dashboard, by bringing together monitoring data points across your caching and database layer and access it quickly to pinpoint bottlenecks and issues causing latency.

Computed metrics for Memcached clusters
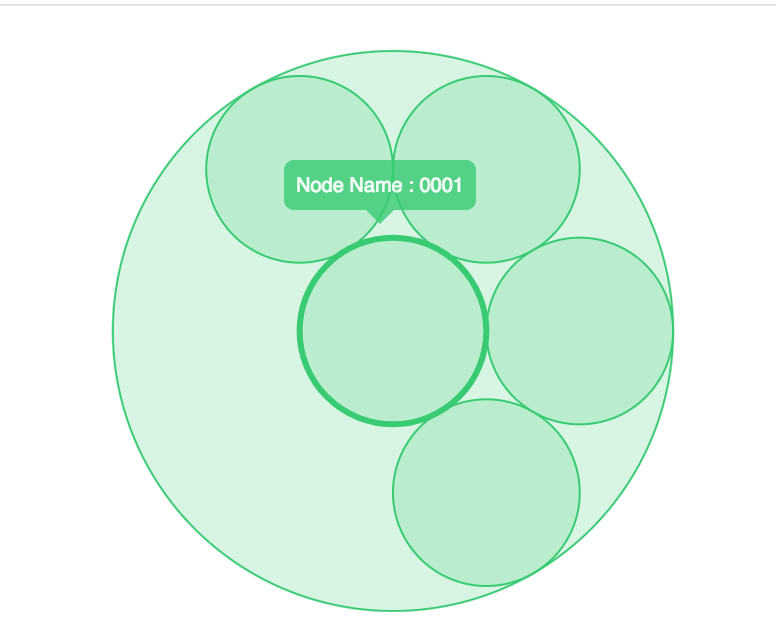
Data points from your cache nodes are collected and aggregated to give you an overview of your cluster performance.

Important caveats
- Both Primary Read/Write node and Read Only replicas (Redis Engine) will be discovered for monitoring.
- Monitoring support for Redis (cluster mode enabled) is not available in this release
- Cluster level view for the Memcached engine will be disabled if you are running a single node cluster
- Metrics are collected at a 5-minute interval and retained for an entire month. Also, historical data points will get retained at lower levels of granularity (1 hour - 3 years, 1 day - 5 years)
Licensing
Every ElastiCache Memcached cluster, Memcached Node, and Redis node will be considered as a basic monitor.
Getting started (Existing users)
To start monitoring the performance of your ElastiCache instances, log into the Site24x7 console and navigate to the Edit section of an already integrated AWS account. (AWS > Inventory dashboard > hamburger icon > Edit) Here, scroll down to the "Services to be discovered" section, check the ElastiCache service and click on save.
Before you click on "Save," please ensure the following:
- Please make sure you have enough units of basic monitors in your Site24x7 subscription license or else the discovered cache nodes will be moved to a suspended state.
- Next, permissions. If you have already assigned complete ReadOnly access to the Site24x7 IAM user or to the cross-account IAM role, then you can sit back. If not, please attach the AWS managed policy "ReadOnlyAccess" or update the assigned policy with our custom policy JSON.
After discovery, three new listings EC-Memcached cluster, EC-Memcached node and EC - Redis will get added to the monitored AWS account drop-down. For new users, all the supported services will be checked by default, so you can get started right away and begin monitoring critical AWS cloud services in minutes.
Help Resource
- Setup, supported metrics, required permissions
- Configure thresholds for your Memcached nodes/clusters and Redis nodes.
Like promised in our previous community post, we've delivered monitoring support for another key AWS service. But the good news is a lot more new features and enhancements are in the pipeline, so stay tuned. As usual, If you have any questions or feedback, we'd love to hear it!