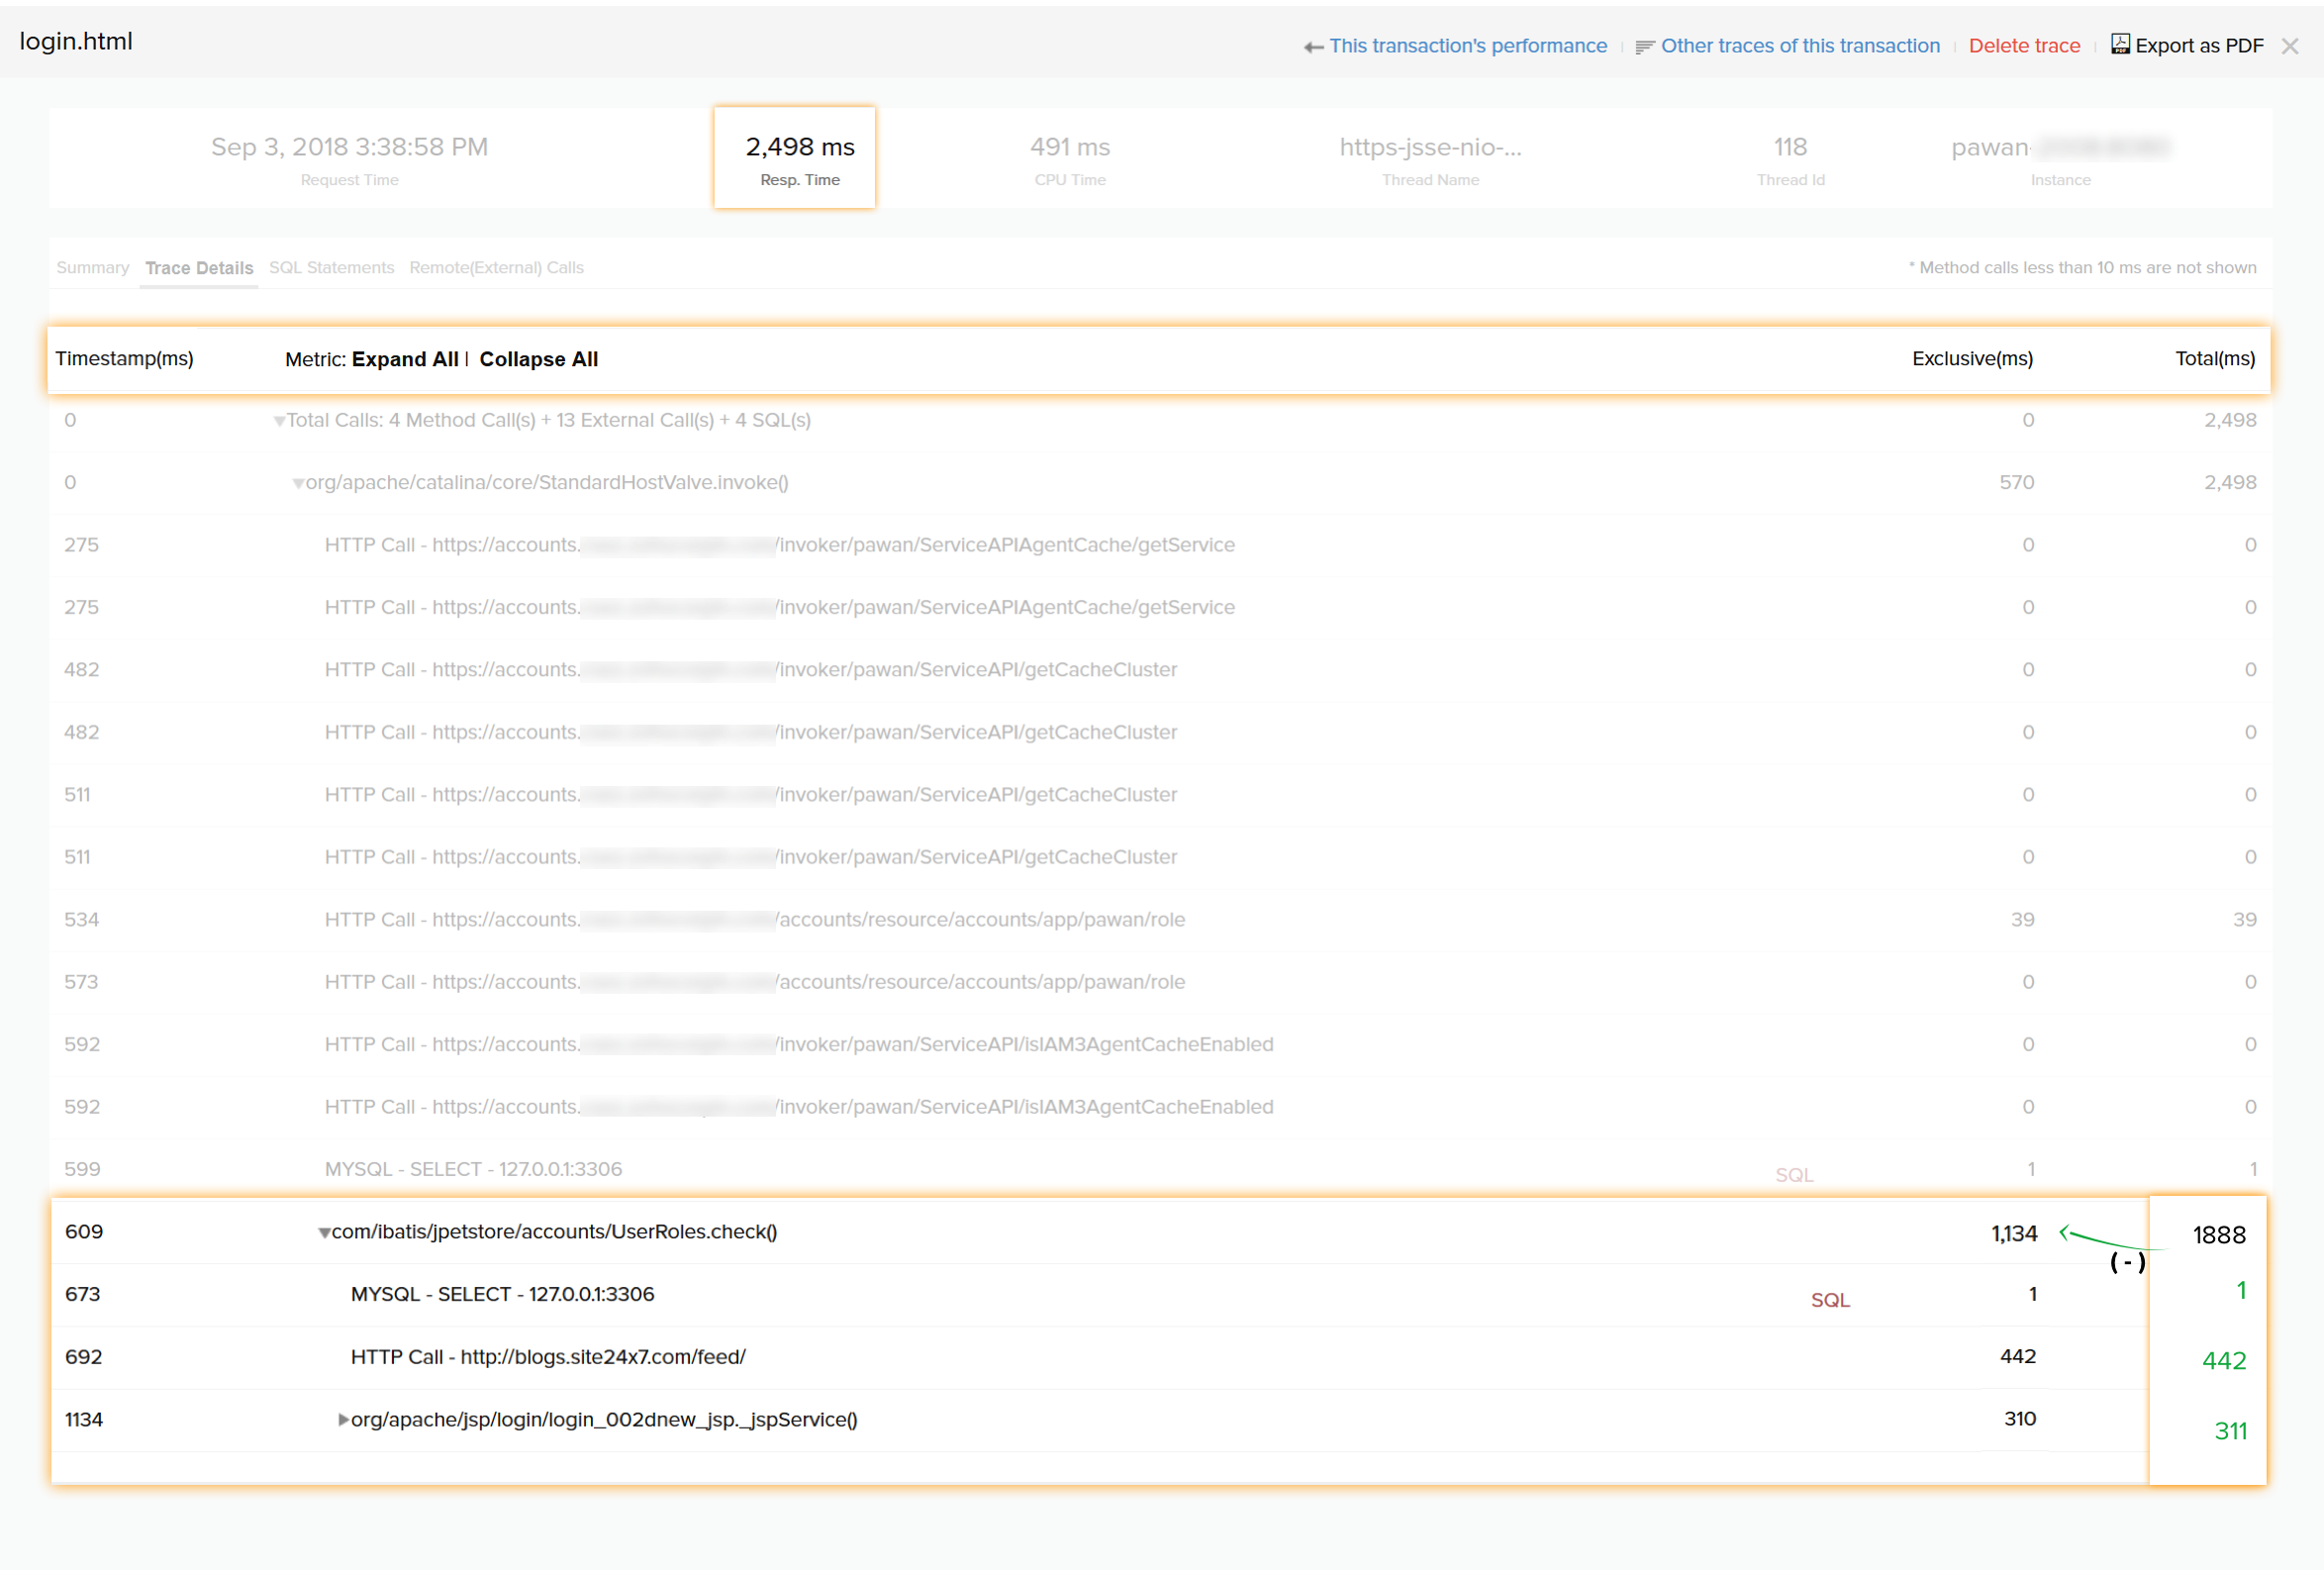
In APM Insight, every transaction's trace details includes the following information:
- Timestamp
- Exclusive time taken
- Total time taken
Timestamp give us the timeline of the entire transaction from the second it begins to the second it's completed.
Exclusive time taken is the time taken by the individual method call alone, excluding the method calls nested within and tracked by the agent.
Total time taken is the combined time taken by the method call along with its subsequent child method calls.
So how does this help with debugging?
Consider this transaction: login.html. Execution takes 2.5 seconds. To optimize this transaction, we need to dig into the traces.

Inspecting further, we see that the Accounts function took 1.8s in total. The three other subsequent child functions triggered by the parent function took a total time of 754ms. This leads us to the conclusion that the parent function alone took a total of 1.1s.
By optimizing the concerned function, we can easily reduce the time taken by this transaction.