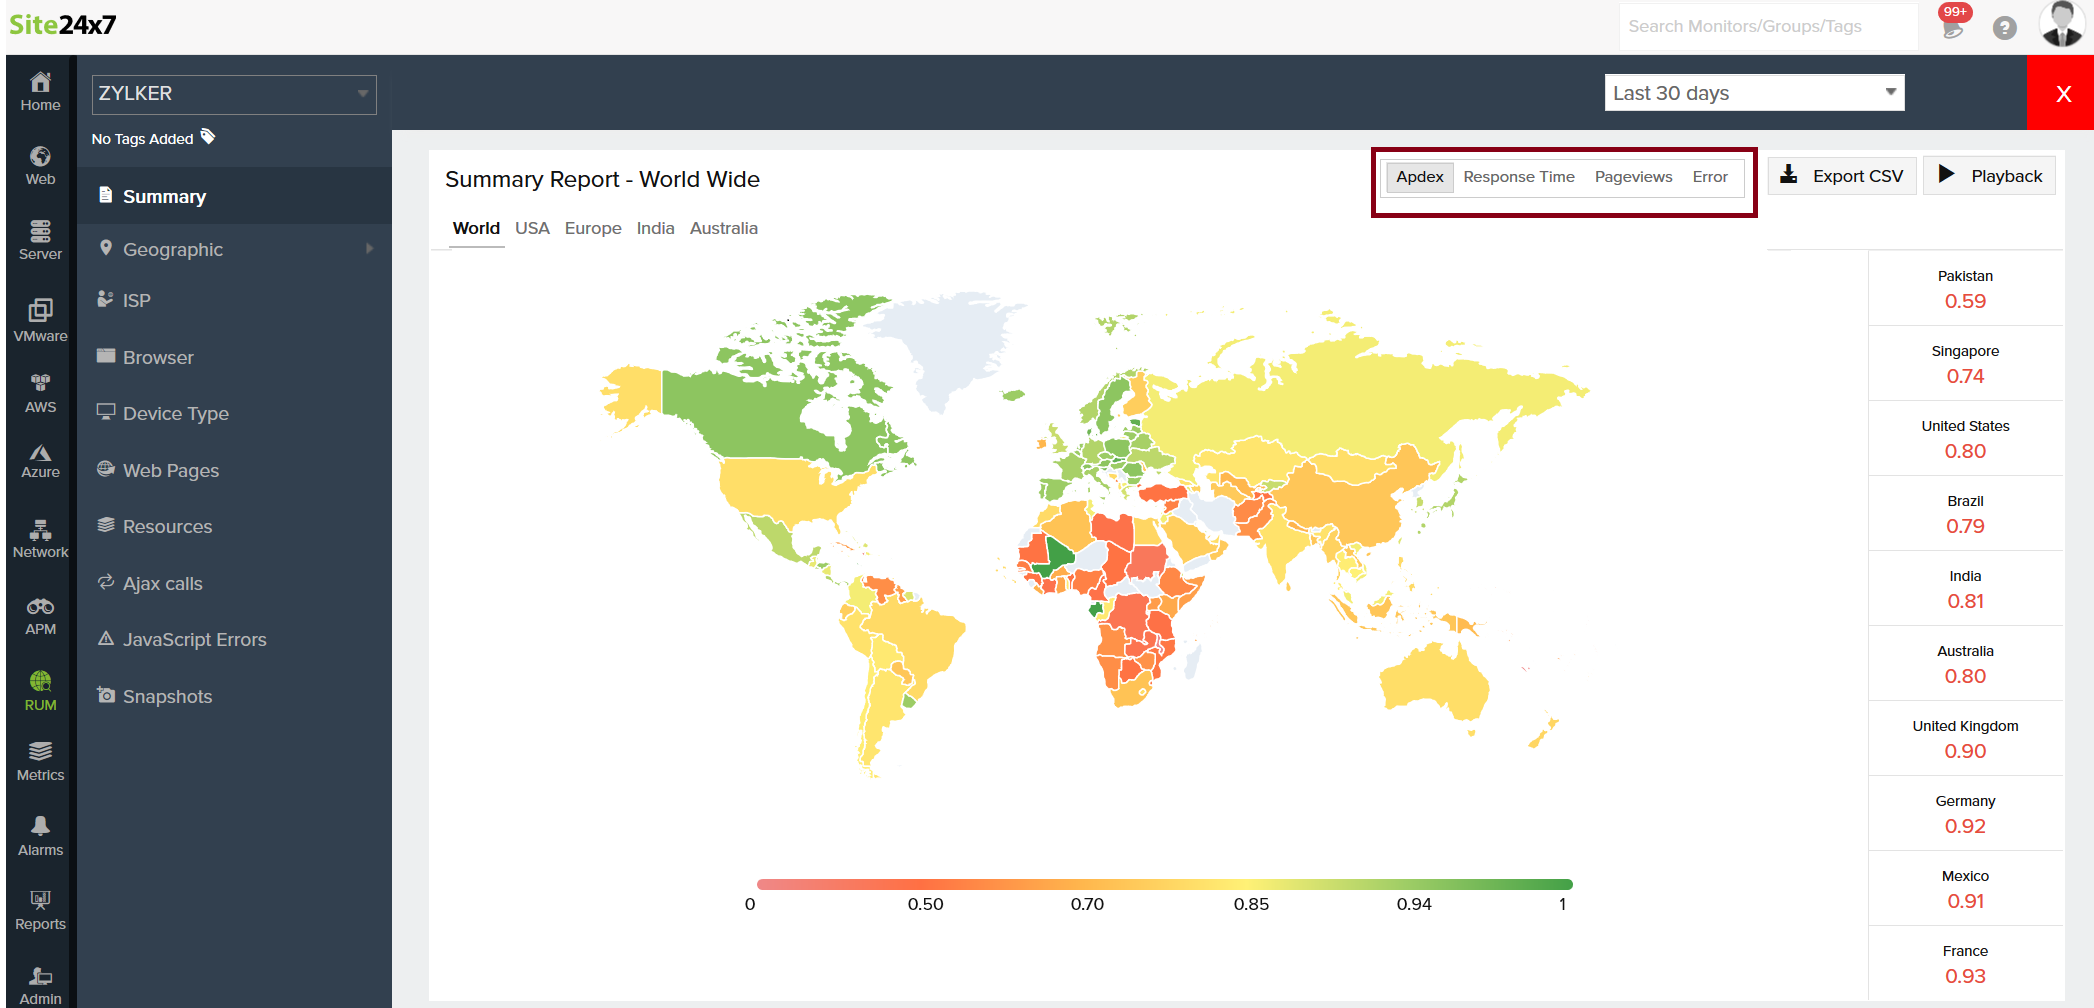
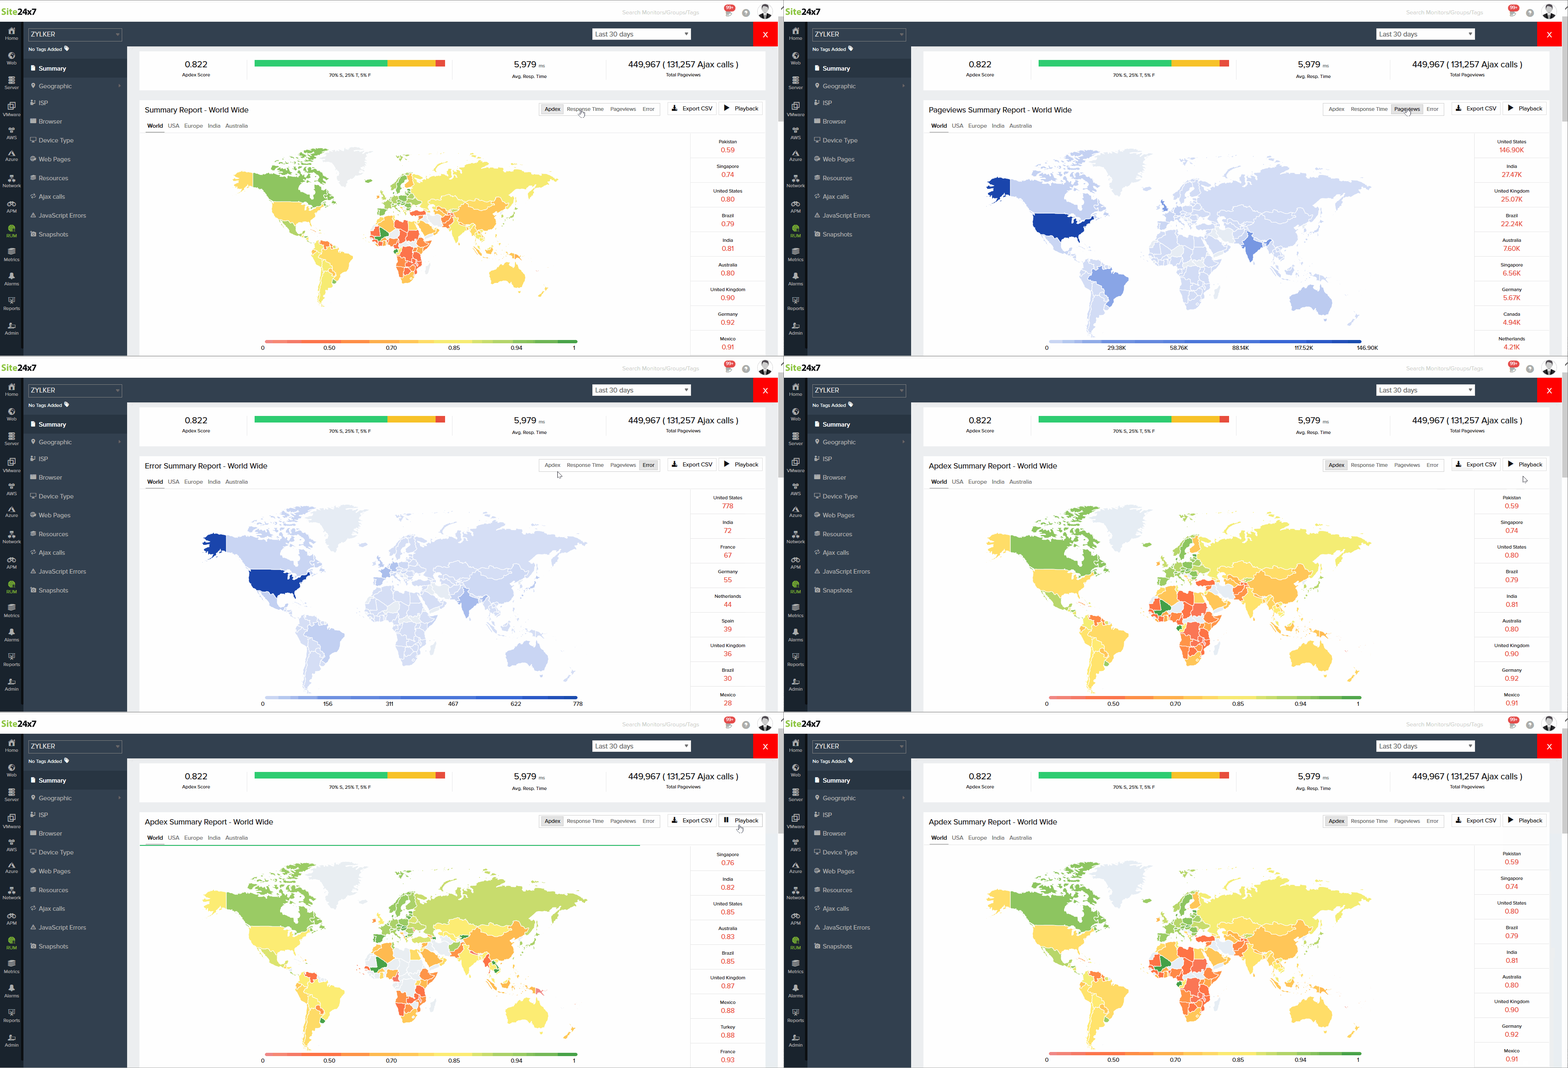
We've enhanced our RUM geographic maps so you can now view the response time of your application across various regions for a chosen time period. Since the RUM maps already show you your application's Apdex score, you can now correlate the changes between Apdex and response time with just a quick glance. Increased response times result in poor Apdex scores and vice versa—knowing the response time and Apdex score of your application helps you enhance the end-user experience.

Aside from Apdex scores and response times, you can also view other parameters like page views and error count across various regions. You can also view changes to any of these parameters using RUM playback.

Try it out and let us know what you think in the comment section below.