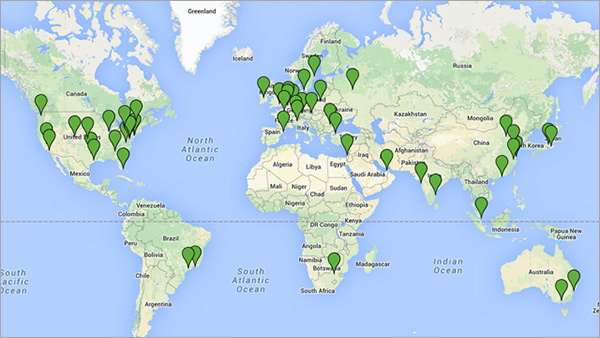
Get your websites monitored from over 130 locations and get alerted in case of a downtime with our website monitoring tool.
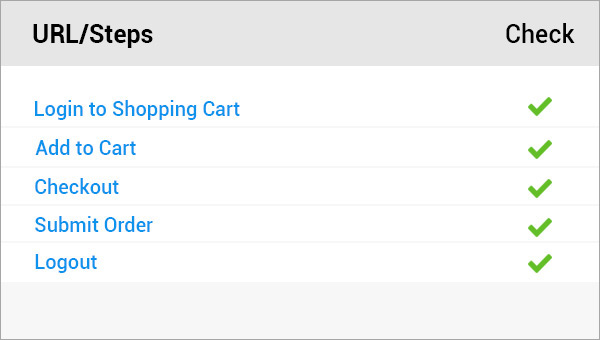
Proactively monitor and measure multi-step user interactions within your web applications (shopping carts, web registrations forms, HR portals, etc.) and oversee response time and content accuracy from start to finish. Site24x7 continuously simulates and monitors these actions from multiple locations, alerting you at the first sign of trouble. Be the first to know when there is a problem – before the first call to your help desk is even placed!
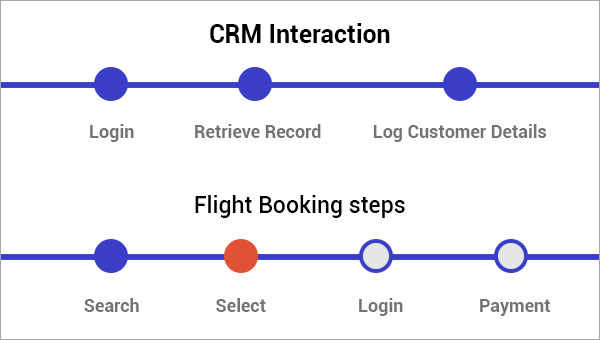
Simulate and measure live end-user experience and complete multi-step interactions for websites or internal-facing web applications. As soon as a problem (slow-down, outage, hacked content, etc.) is detected in any step, an Email, SMS, Voice or mobile push notifications will be immediately sent so you can rapidly correct the problem, before your users are impacted.
Validate user experience from over 130 locations worldwide, inside your firewall, or both. Build realistic testing scenarios (e.g. top revenue regions, remote workers, new geo-targeted regions, etc.), and identify geographical response time discrepancies early on. Ensure quality web experiences across all users.
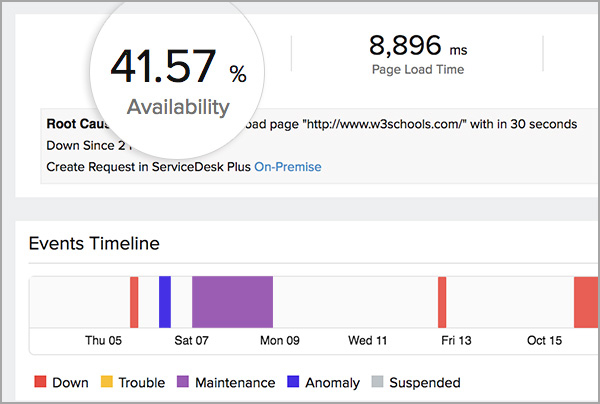
With Site24x7 real-time charts and historical reports, you get a clear picture of how your website is performing over time, from your users’ perspective. Immediately identify trends or performance deviations, and automatically distribute triage information or reports to team members or stakeholders.
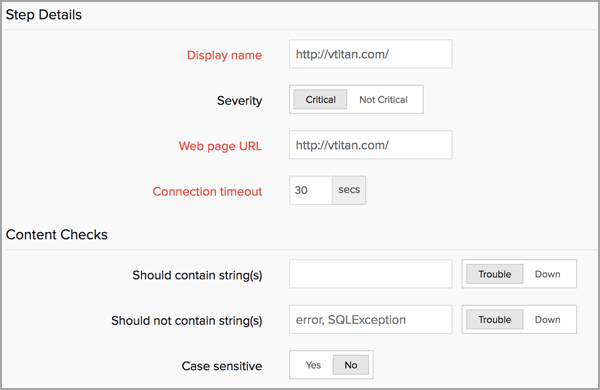
Verify website content accuracy, for each transaction step, and detect errors or hackers much faster. Simply configure keywords that should be in your webpages or not (“hacked by”, “Server overloaded”, “404 error”, etc.) and get immediately alerted as soon as content violations are detected.
Simply point, click & record the steps you want to monitor on a browser-based interface to automatically build your monitoring scripts. It is easy to get started, and you can even simulate and oversee complex Web 2.0 technologies.
Playback monitored transactions using a Chrome or Firefox browser to understand how your web pages would load for your users (great for triage and troubleshooting), or use a Java interface to simulate monitored HTTP requests at a higher frequency (great for uptime and pure response time monitoring). Additionally, you can pinpoint JavaScript errors in your Single Page Applications with Real user monitoring.

We're better able to monitor customer needs and respond quickly to maintain an exceptional level of customer service. With the help of this tool, we can focus less on the day-to-day tasks of keeping our cloud running, and more on continuous improvement, and rapidly delivering innovative, industry -specific solutions for our customers.
Site24x7 gives us a lot of flexibility in being able to add devices as and when they get added, and also taken away as well. One of the most attractive points of the product and which ruled out a lot of the competition was the ability to do web transactions.
I was always very happy with the service at Site24x7.com. Notifications were easy to set up, and the reports were delivered quickly after any outages with clear explanations given. I highly recommend this tool for Website availability monitoring.
Web applications are software programs accessible through web browsers. They offer numerous advantages over traditional desktop applications, including accessibility, ease of use, cost-effectiveness, and scalability.
Web application monitoring is the process of observing and assessing the availability and performance of web-based applications. It provides valuable insights into application behavior and helps identify areas for improvement.
Web application monitoring is crucial for ensuring better uptime, optimal performance, and a glitch-free user experience. By continuously tracking key metrics and identifying potential issues, you can proactively address problems, optimize performance, prevent downtime, make data-driven decisions, and comply with industry regulations. This ultimately leads to providing a better digital experience and helps you achieve your business goals.
Web application monitoring tracks a wide range of user interactions to understand how users engage with your website or application, like
Web application monitoring tools simulate user actions and gauge key metrics, identify bottlenecks, and track errors that might hamper the application performance.
Web application monitoring has limitations including data sampling and aggregation that can obscure real-time issues, limited scope potentially missing critical interactions, latency delays in detecting problems, complexity and cost of implementation, false positives/negatives, a lack of context for troubleshooting, and the potential oversight of non-functional requirements like security and reliability. Moreover, web application monitoring scripts may falter when there are complex user interactions involving dynamic content, like selecting options based on changing inventory. To avoid errors, break down complex tasks into simpler, independent scripts, and prioritize choosing test items with sufficient inventory to prevent real-world disruptions. Over-reliance on a single script can lead to failures when inventory changes or when the monitor attempts to process high volumes of purchases. These factors necessitate a multifaceted approach to application management combining monitoring with other techniques for a comprehensive understanding. And, this can be overcome by a tool that provides real-time inputs and detailed RCA data.
The key strategies for monitoring web application performance include:
Web application performance monitoring is essential for: